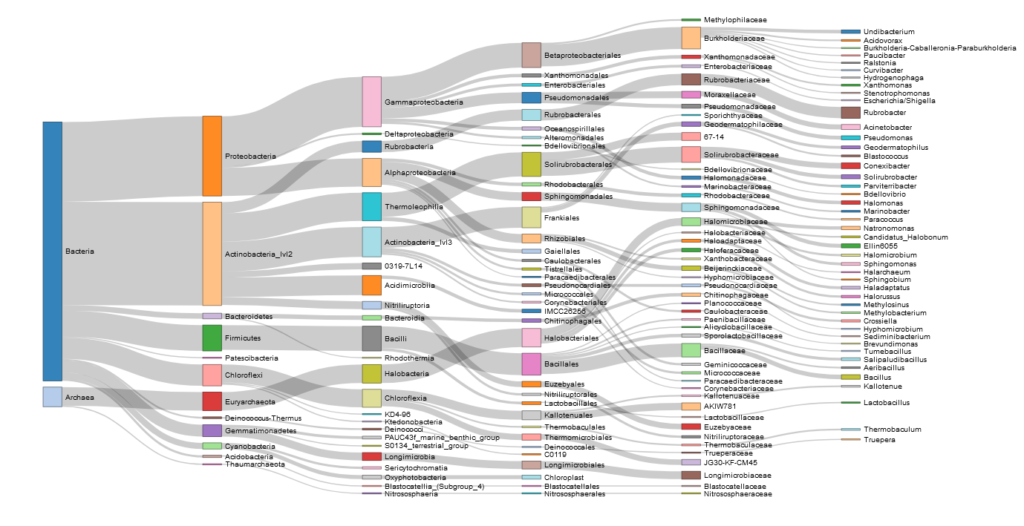
In microbiome analysis, a Sankey plot is used to visualize the distribution and relative abundance of different taxonomic levels within a microbial community. It illustrates the flow of microbial populations from higher taxonomic ranks (such as phyla) to lower ranks (such as species). The plot uses arrows or links, with widths proportional to the frequency of occurence of each taxon, to show how microbial diversity is partitioned and how different taxa contribute to the overall community structure.
Usage: This tool can be used to show the taxonomic distribution of an amplicon (e.g. 16S or 18S rRNA) dataset
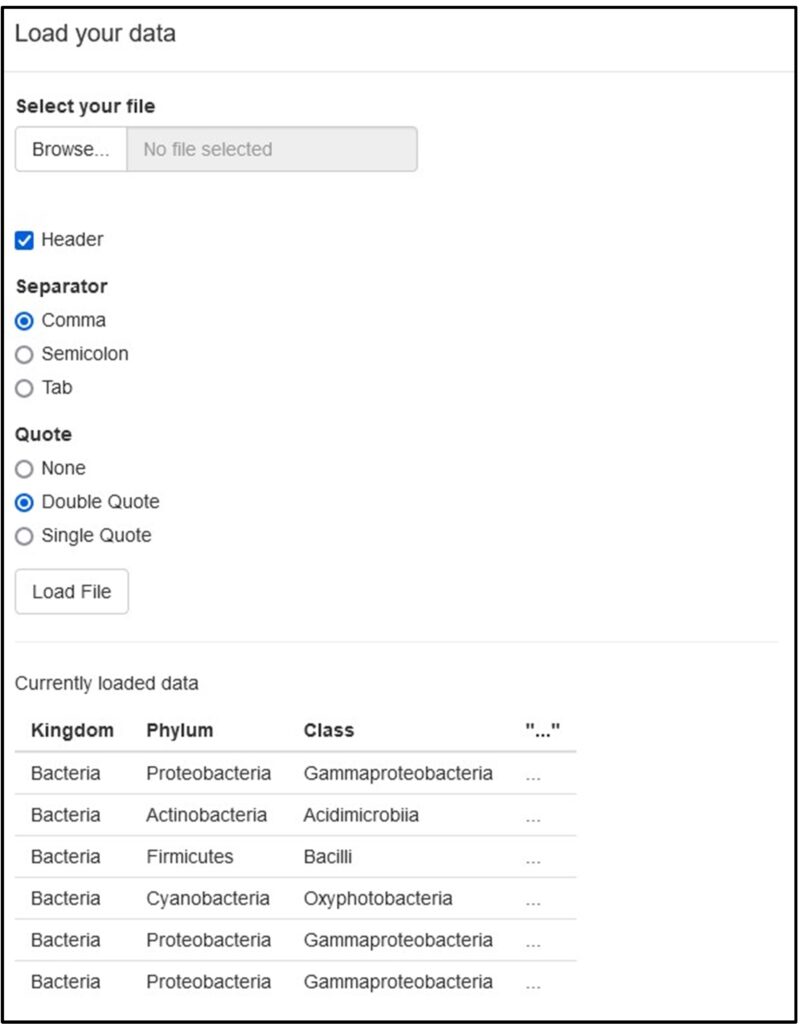
Input needed: A CSV file listing the taxonomy of each identified ASV (an example can be downloaded here)
Output: An SVG File showing the distrivution for different taxonomic levels across the dataset